
Chris Hardman, Chief Fire Officer
Victoria is one of the most fire-prone areas in the world.
In past decades, Victorians have seen the disastrous
effects bushfires can have on communities.
Under the Forests Act 1958 and in line with the
Code of Practice for Bushfire Management on Public Land 2012,
Forest Fire Management Victoria (FFMVic),
is responsible for managing bushfire risk on public land.
What's happening near me?


2020 ADDENDUM: Best available data
This report, and the figures presented here, are based on the best available data and model outputs available at the time of publication in 2019. Each year we update models and data layers, which can affect historic data and model outputs.
Because of these ongoing improvements being made to our models and data, it is recommended that for the most accurate view of current and historic figures, you always consult the most recent fuel management report. The most recent report is available at www.ffm.vic.gov.au under monitoring, evaluation and reporting.
Changes to reported costs
Changes in the split between direct and indirect costs have been applied retrospectively in Table below to enable a direct comparison between financial years the four financial years shown, based on the accounting methodology applied in 2018-19.
The fuel management program expenditure is split between direct and indirect costs. Specific amendments have been made to better capture the activities related to fuel management and non-fuel management expenditure due to continual improvements made to the accounting methodology and categorisation of expense types over time. The changes reported herein for direct and indirect expenditure within the fuel management program for 2015-16, 2016-17 and 2017-18 are the result of changes made to the categorisation of costs as being direct, indirect and/or non-fuel management expenses.
Direct costs relate to expenditure that can be directly and reliably assigned to individual operations such as materials, plant and aircraft hire, overtime and allowances, accommodation and meals. Indirect fuel management costs include expenses relating to base salaries, training, vehicles, equipment, planning and community engagement. Non-fuel management expenses are typically those relating to preparedness and fire and emergency response activities, such as fire radio network costs, systems and aviation spend.
Table: Changes to reported fuel management expenditure in the current and previous fuel management reports
Report year | 2015-16 ($m) | 2016-17 ($m) | 2017-18 ($m) | 2018-19 ($m) |
|---|---|---|---|---|
Total Fuel Management expenditure reported in current year (based on 2018-19 accounting method) | 108.5 | 97.9 | 113.5 | 121.7 |
Direct Fuel Management expenditure reported in current year | 12.3 | 11.2 | 14.6 | 18.2 |
Indirect Fuel Management expenditure reported in current year | 96.2 | 86.7 | 98.9 | 103.5 |
Total Fuel Management expenditure reported that year | 133.2 | 107.9 | 107.8 | 121.7 |
Direct Fuel Management expenditure reported that year | 44.3 | 40.0 | 30.4 | 18.2 |
Indirect Fuel Management expenditure that year | 88.9 | 67.9 | 77.4 | 103.5 |
Net change in Fuel Management reported expenditure | -24.7 | -10.0 | 5.7 | No change |
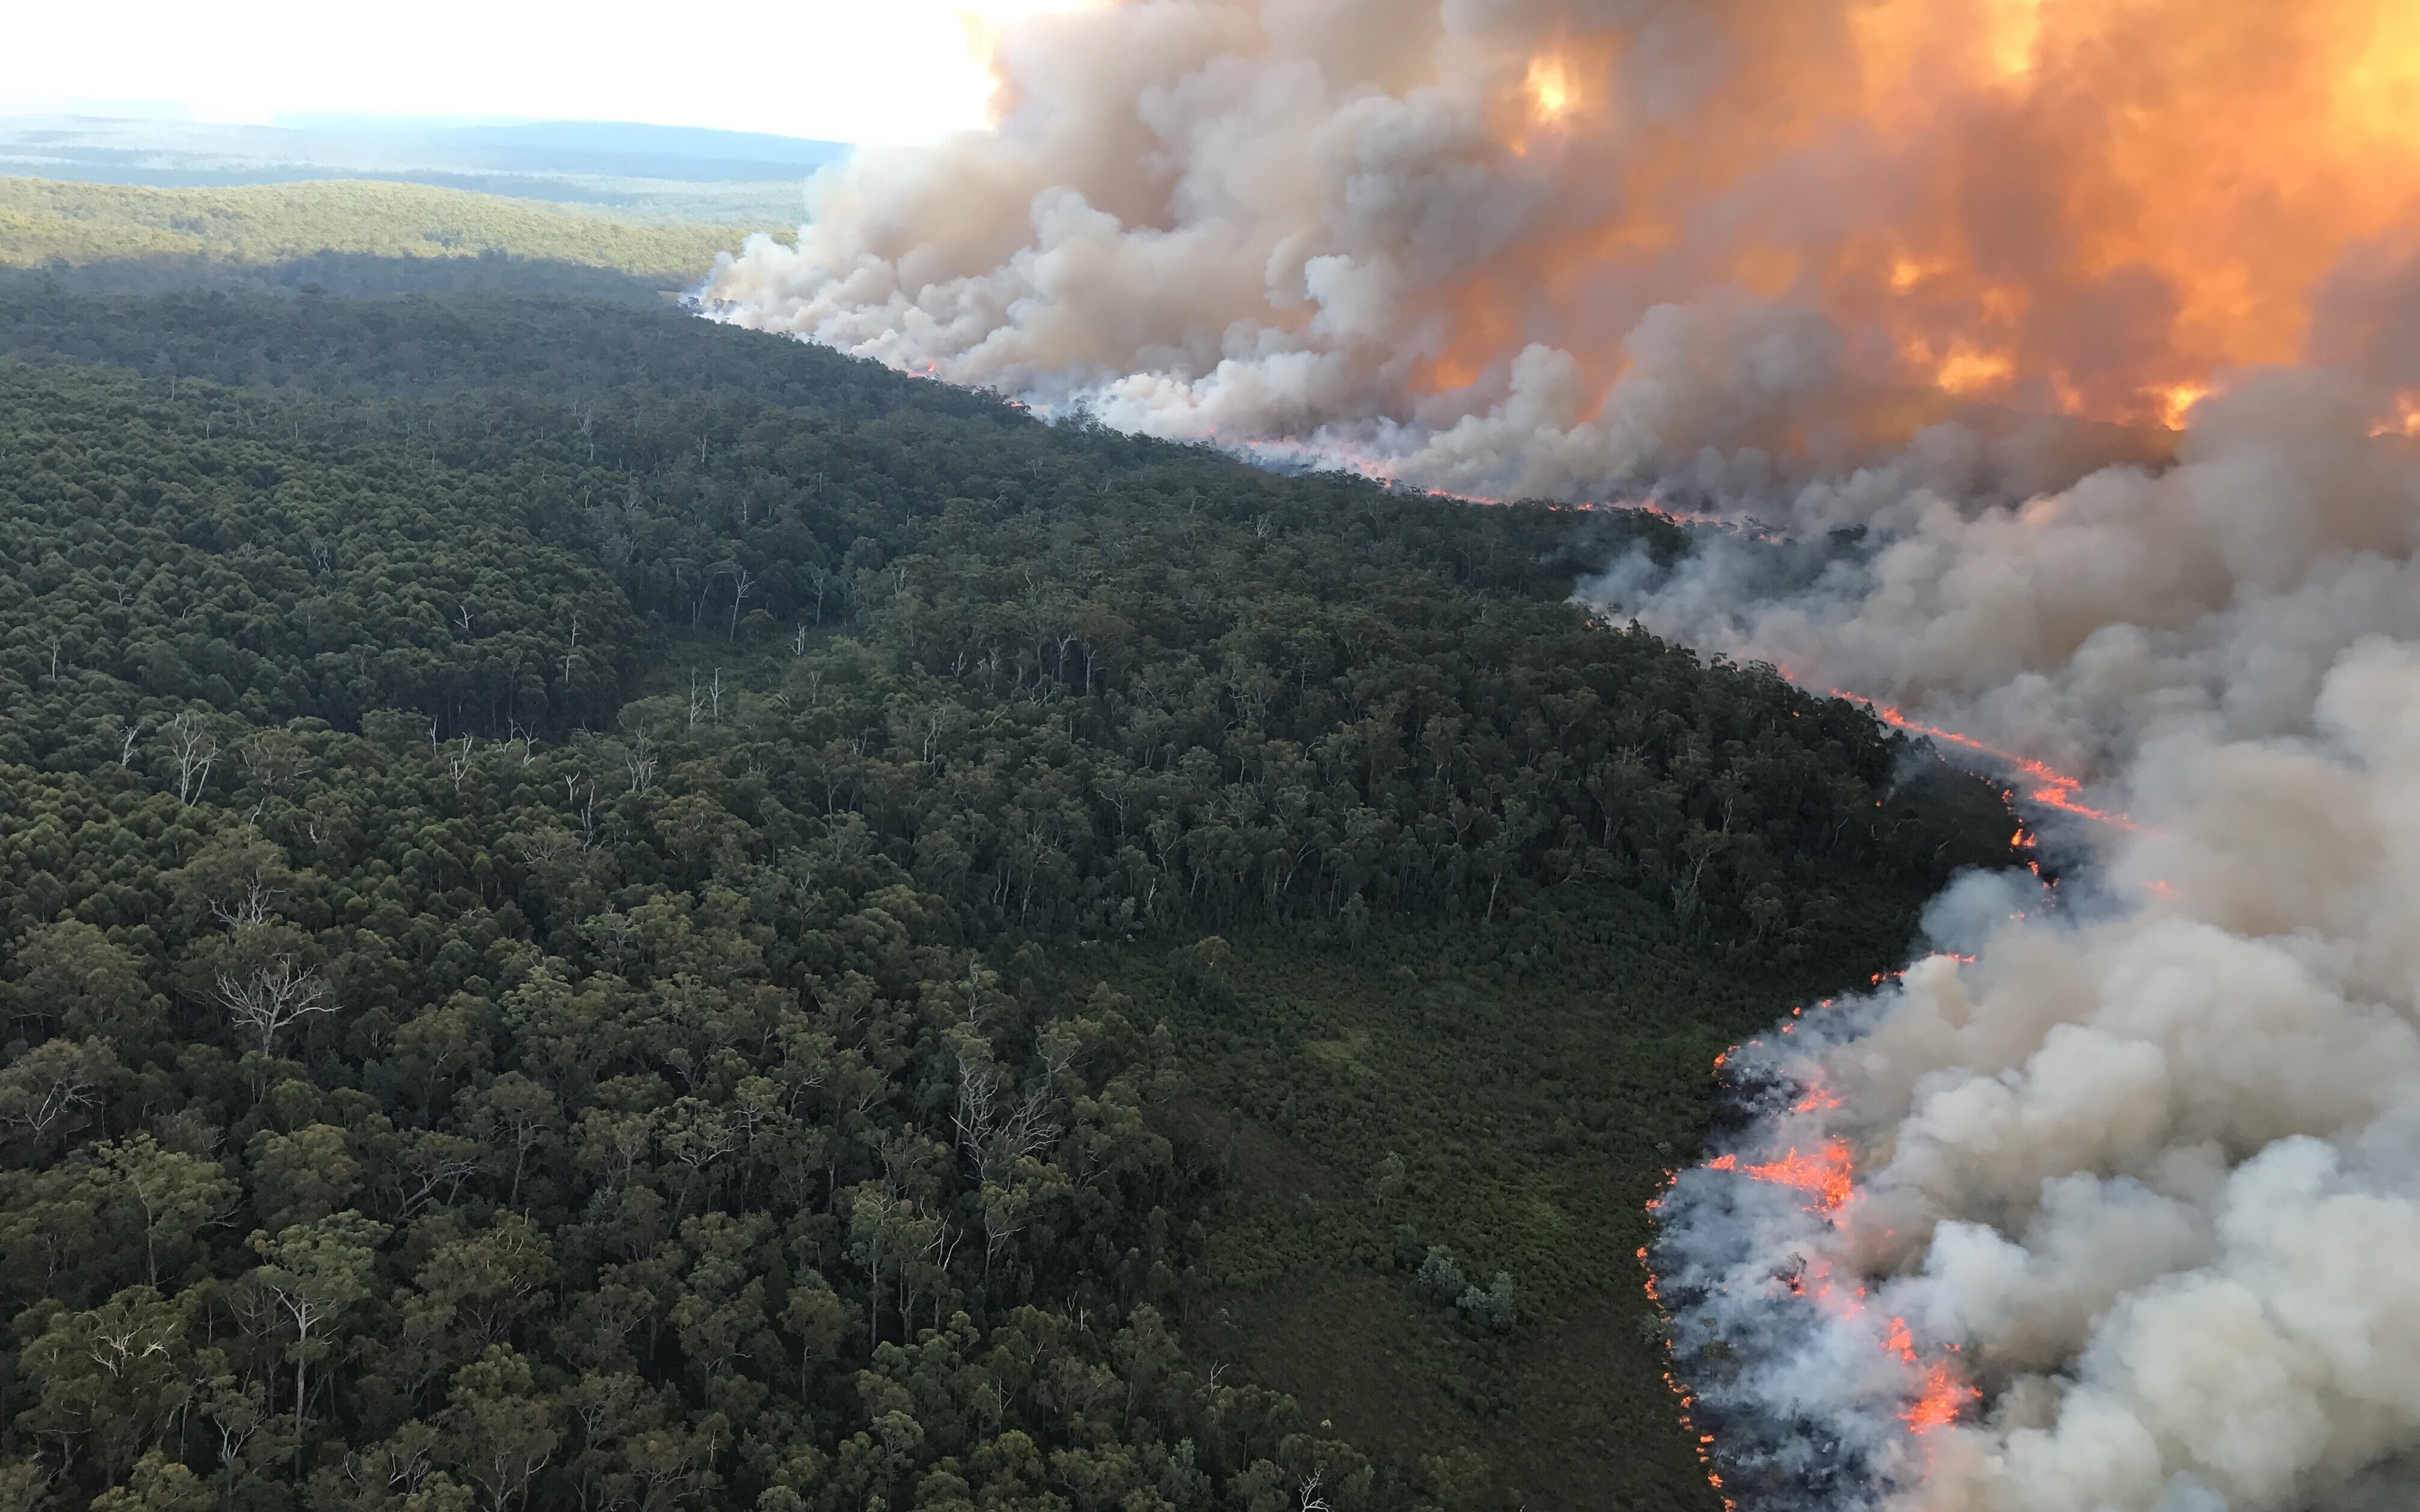
Banner image credit: Dom Uljanic